Kubernetes Memory Insights: Pod Memory Behavior and The Curious Case of `hostPath` Access
Introduction
Depending on the use case, sometimes people would use hostPath to mount a file or directory from the host node’s filesystem into their Pods.1 An interesting observation is that when accessing the files mount to a Pod, the memory from kubectl top pod would change. This article describes such scenarios and explain the reason behind this behaviour.
Issue Description
Consider a scenario where a Pod is configured as follows:
- A directory is mounted from the host to the Pod.
- A file is created within the Pod.
- The file is then mounted from the Pod back to the host.
1
2
3
4
5
6
7
8
9
10
11
12
13
14
15
16
17
18
19
20
21
22
23
24
apiVersion: v1
kind: Pod
metadata:
  name: app
spec:
  containers:
  - name: app
    image: centos
    command: ["/bin/sh"]
    args: ["-c", "dd if=/dev/zero of=/root/out.txt bs=1M count=4096; while true; do sleep 5; done"]
    volumeMounts:
    - name: mylogdir
      mountPath: /root
    - name: mylogfile
      mountPath: /root/out.txt
  volumes:
  - name: mylogdir
    hostPath:
      path: /home/ec2-user
      type: DirectoryOrCreate
  - name: mylogfile
    hostPath:
      path: /home/ec2-user/out.txt
      type: FileOrCreate
Upon creating the Pod and accessing the out.txt file from the host by commands like cat or copy, a surprising observation emerges: the memory utilization, as shown by kubectl top pod, gradually increases:
1
2
3
4
5
6
7
8
9
10
11
12
13
14
15
16
17
18
19
20
21
2023-12-11T15:01:41
POD NAME CPU(cores) MEMORY(bytes)
app app 7m 12Mi

# Start accessing the file

2023-12-11T15:01:44
POD NAME CPU(cores) MEMORY(bytes)
app app 8m 842Mi

2023-12-11T15:01:53
POD NAME CPU(cores) MEMORY(bytes)
app app 8m 842Mi

2023-12-11T15:01:56
POD NAME CPU(cores) MEMORY(bytes)
app app 8m 842Mi

2023-12-11T15:02:00
POD NAME CPU(cores) MEMORY(bytes)
app app 8m 1915Mi
Here we can see the Pod memory utilization increased gradually while in fact that the Pod memory utilization should not change as the Pod did nothing after creating the file. So why does this happen?
Diving Into The Behaviour
To further dive deep why the memory metrics change, I got the detail cgroup memory metrics from /sys/fs/cgroup/memory/memory.stat within the pod when I observed the kubectl top pod memory metric change. I compared the metrics before and after:
1
2
3
4
5
6
7
8
9
10
11
12
13
14
15
16
17
18
19
20
21
22
23
24
25
26
27
28
29
30
31
32
33
34
35
$ diff metrics1.txt metrics2.txt
1,2c1,2
< 2023-12-11T15:01:30
< 4307865600
---
> 2023-12-11T15:02:06
> 4307877888
11,13c11,13
< pgpgin 1062468
< pgpgout 13427
< pgfault 29172
---
> pgpgin 1072797
> pgpgout 23842
> pgfault 51744
17,18c17,18
< inactive_file 3339055104
< active_file 955908096
---
> inactive_file 2145656832
> active_file 2149306368
30,32c30,32
< total_pgpgin 1062468
< total_pgpgout 13427
< total_pgfault 29172
---
> total_pgpgin 1072797
> total_pgpgout 23842
> total_pgfault 51744
36,37c36,37
< total_inactive_file 3339055104
< total_active_file 955908096
---
> total_inactive_file 2145656832
> total_active_file 2149306368
I noticed the following:
- The sum of
inactive_fileandactive_fileis approximately 4GB which is the file size we created in the pod:- (3339055104 + 955908096)/1024/1024/1024 = 4GB
- (2145656832 + 2149306368)/1024/1024/1024 = 4GB
- The difference of
inactive_fileis around 1130 MB, while the difference ofkubectl top podis 1903 MB- (3339055104 - 2145656832)/1024/1024 = 1138 MB
- 1915 MB - 12 MB = 1903 MB
Thus I assume that the inactive_file is a factor in this memory change scenario and how kubectl top pod calculate memory utilization involve inactive_file.
Explanation
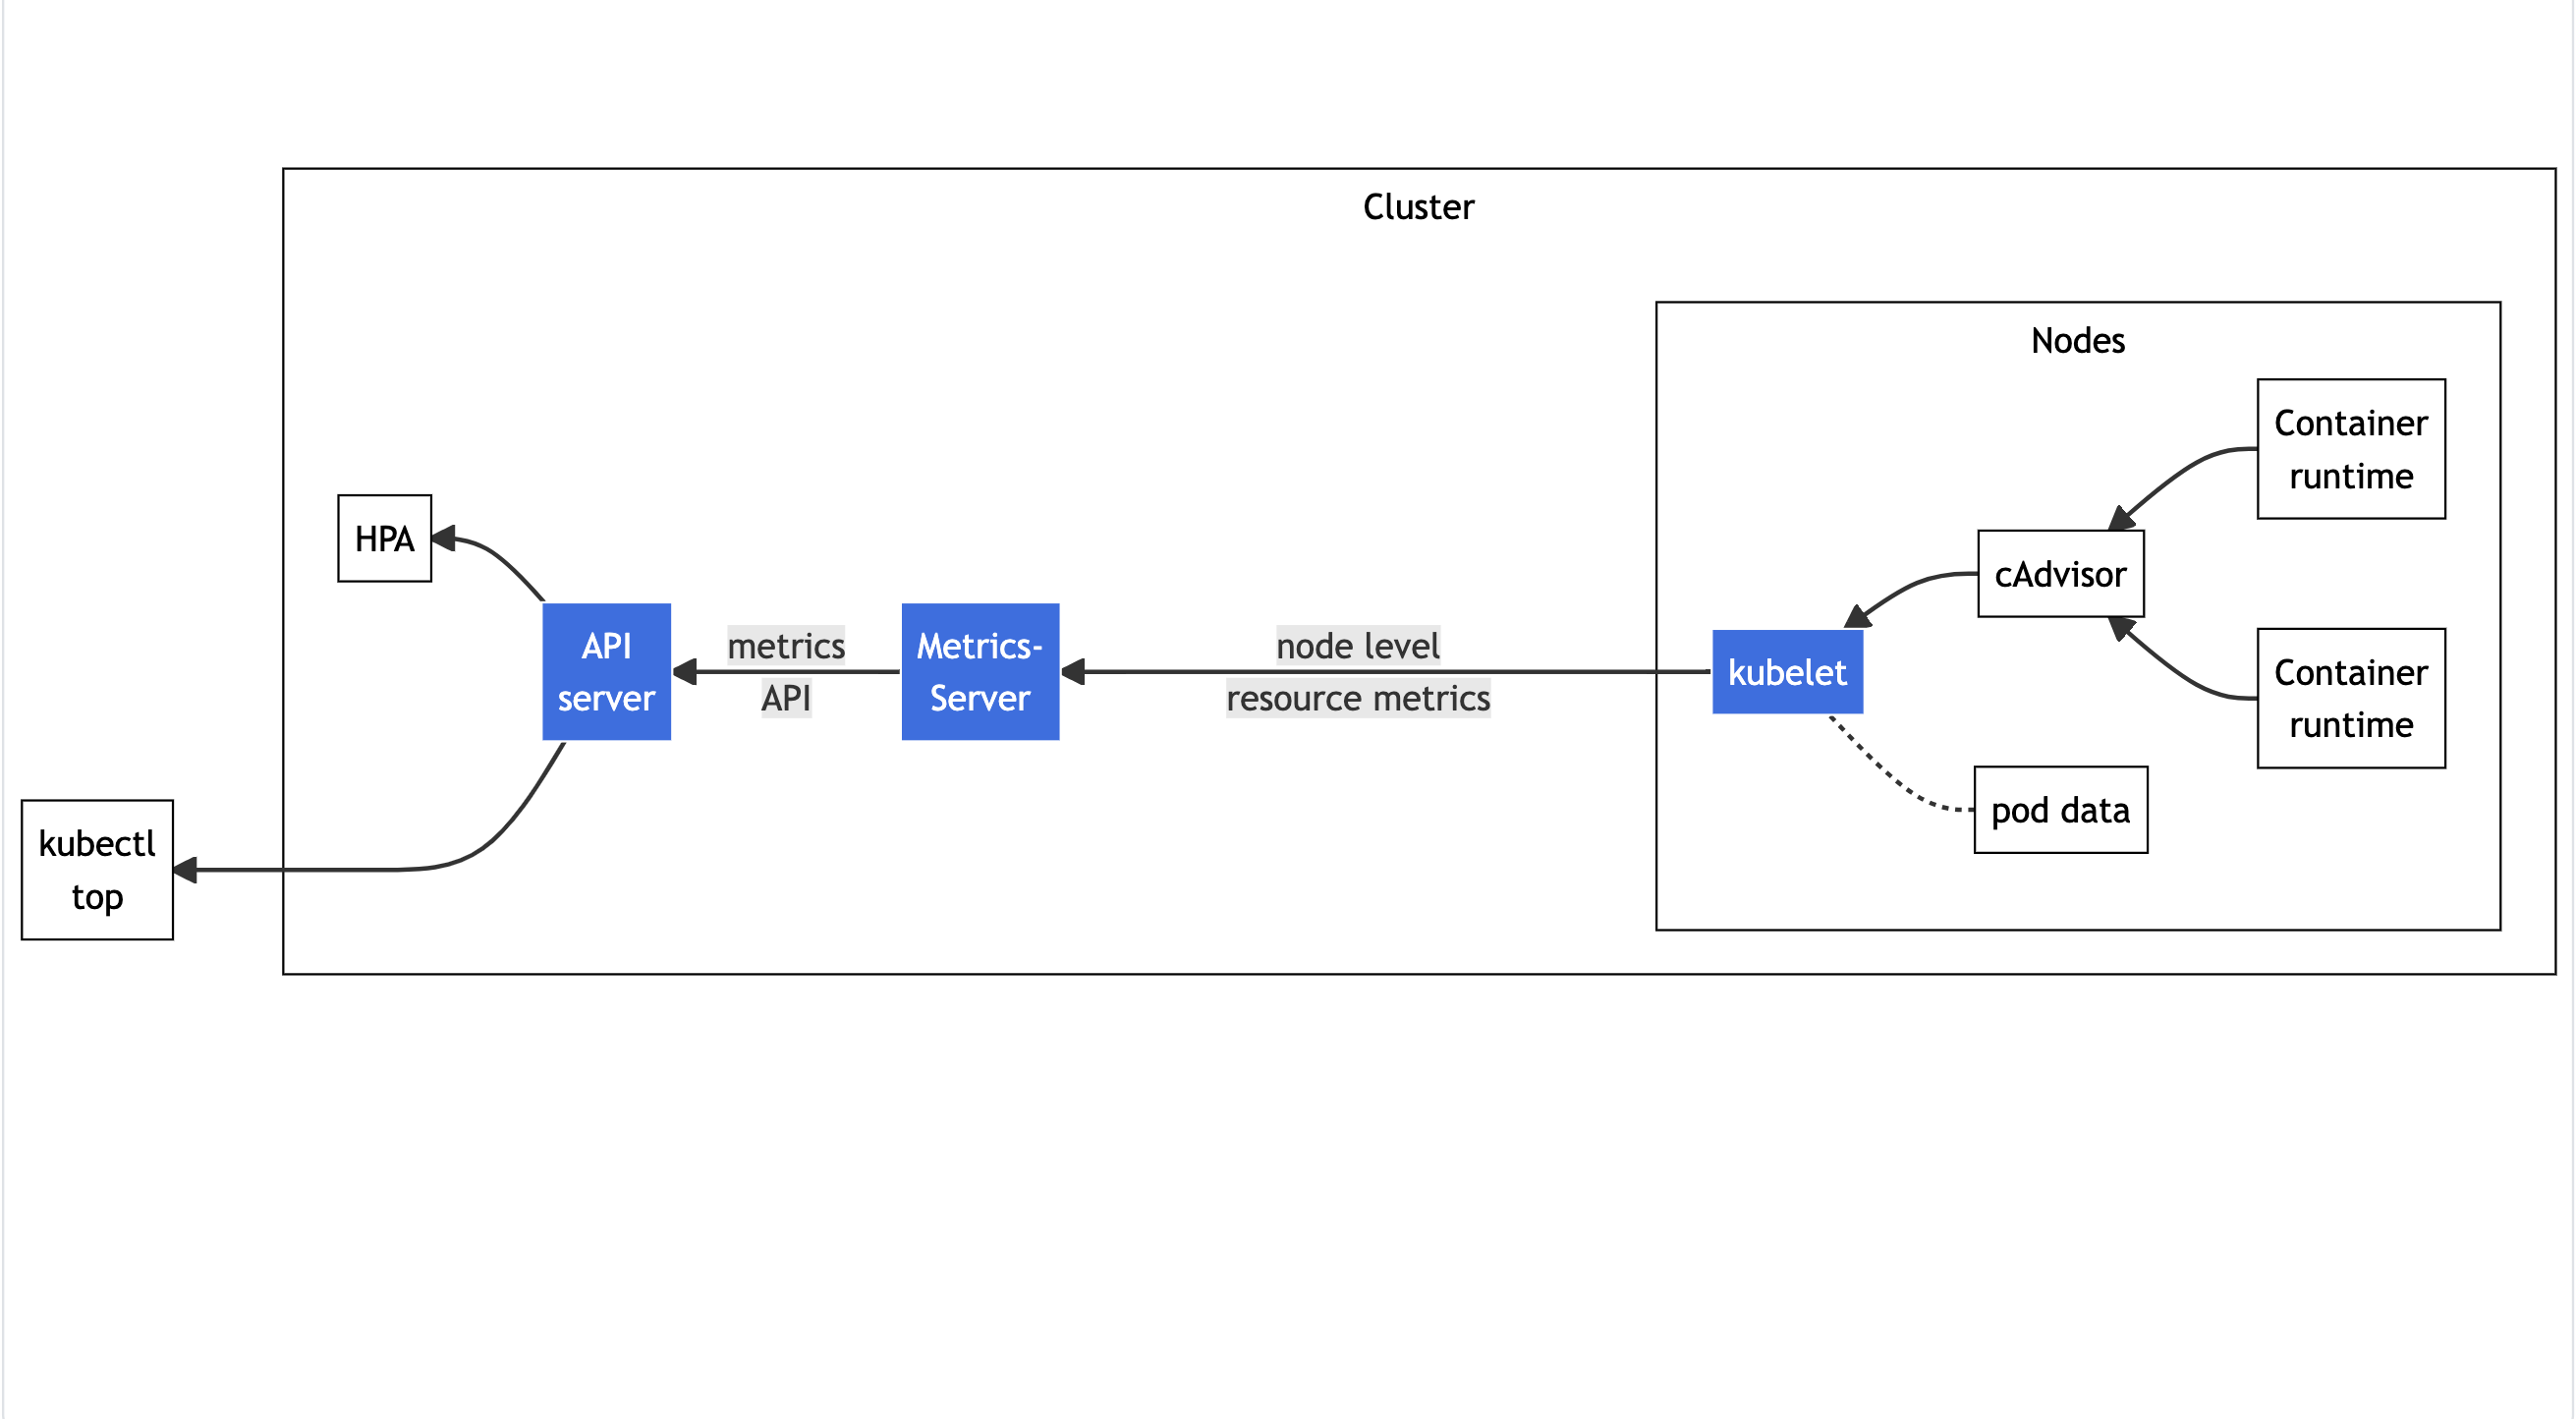
Resource Metrics Pipeline
First begins with understanding how kubectl top pod fetches memory metrics. We can see the source where kubectl top commands get the metrics from is cadvisor.
cadvisor Memory Calculation
From cadvisor issue, we can see that cadviosr reports working_set:2
cadvisor reports working_set, which is usage - inactive_file. working_set is the value used by kubernetes to make eviction decisions, which is why cadvisor produces it.
The Kubernetes documents describes the eviction based on memory:
The value for
memory.availableis derived from the cgroupfs instead of tools likefree -m…. The kubelet excludes inactive_file (the number of bytes of file-backed memory on the inactive LRU list) from its calculation, as it assumes that memory is reclaimable under pressure.
Here we can see indeed if the inactive_file decrease, the kubectl top reported from cadvisor will increase. But in our use case, why accessing the file from host-level would affect how cgroup report the cgroup memory usage?
cgroup Memory Ownership / Accounting
I first get an insight from Docker document about the concept of cgroup memory ownership3 :
Accounting for memory in the page cache is very complex. If two processes in different control groups both read the same file (ultimately relying on the same blocks on disk), the corresponding memory charge is split between the control groups. It’s nice, but it also means that when a cgroup is terminated, it could increase the memory usage of another cgroup, because they are not splitting the cost anymore for those memory pages.
Here we can see the situation when processes in different cgroup access same file, it may affect the memory usage in both cgroup.
In cgroup v1 we can see that the way to assign the ownership of memory page cache is based on first-touch approach:4
Shared pages are accounted on the basis of the first touch approach. The cgroup that first touches a page is accounted for the page. The principle behind this approach is that a cgroup that aggressively uses a shared page will eventually get charged for it.
In cgroup v2 we can see similar explanation:5
A memory area is charged to the cgroup which instantiated it and stays charged to the cgroup until the area is released. .. A memory area may be used by processes belonging to different cgroups. .. As memory controller assigns page ownership on the first use and doesn’t update it until the page is released, even if writeback strictly follows page ownership, multiple cgroups dirtying overlapping areas wouldn’t work as expected. It’s recommended to avoid such usage patterns.
Here matches to what we observed: the pod first created the file, the cgroup of the pod is accounted for the cache of the file. When we access the same file, the cache become from inactive_file to active_file. However, due to the ownership of the cache, the memory metrics still reflects on the cgroup memory of the pod.
Summary
This article describes how Kubernetes calculate the pod memory usage and the cgroup memory ownership method leads to what we observed: accessing file from host level might affect the pod memory usage. The discussion about if Kubernetes should calculate working_set based on inactive_file, active_file has be a long discussion6. For now we need to keep in mind that how Kubernetes calculate working_set and sometimes to get insight of the pod memory usage change, we can gather the information from the metrics source, cgroupfs memory metrics.