Amazon ECS Performance Observability: A Guide to Monitoring Tasks and Containers with CloudWatch ContainerInsight
Introduction
Monitoring Amazon ECS tasks and containers is critical for diagnosing performance bottlenecks, optimizing resource usage, and ensuring application reliability. Common methods, like deploying sidecar containers, often add complexity and overhead. Amazon CloudWatch Container Insights simplifies this process by offering a fully managed solution to collect and visualize task- and container-level metrics.
In this article, we will use Amazon CloudWatch Container Insights and Amazon CloudWatch metric filters to collect and visualize the task-level and container-level performance metrics. By applying this method, you can gain a more straightforward understanding of ECS task and container performance.
Currently ContainerInsight has a feature: enhanced observability to visualize the task/container-level monitoring. You can either use enhanced observability for account-level or cluster-level resources, or use the method in this article to monitor certain ECS service/task based on their business.
Setup the Metric Filter
Once we enable CloudWatch Container Insight, the Amazon ECS container agent or AWS Fargate will start to send container logs and metrics to Amazon CloudWatch. Then, we can design the metric filters based on your needs to observe Amazon ECS task and container-level performance. The potential scenarios include checking a single task’s performance when there is an imbalanced workload on the Amazon ECS service or distinguish which container is exhausting memory, disk, CPU, or network resources in an ECS task with multiple containers.
In this approach, there are two major steps that need to be completed:
- Set up the metric filter for task-level metrics.
- Set up the metric filter for container-level metrics.
Note: The table below summarizes the metric filter configurations for monitoring ECS task and container performance.
| Metric Name | Filter Name | Metric Value | Dimensions |
|---|---|---|---|
| Task CpuUtilized | Task Utilized CPU | $.CpuUtilized | ClusterName, ServiceName, TaskId |
| Task MemoryUtilized | Task Utilized Memory | $.MemoryUtilized | ClusterName, ServiceName, TaskId |
| Container CpuUtilized | Container Utilized CPU | $.CpuUtilized | ServiceName, TaskId, ContainerName |
| Container MemoryUtilized | Container Utilized Memory | $.MemoryUtilized | ServiceName, TaskId, ContainerName |
Task-level Metrics
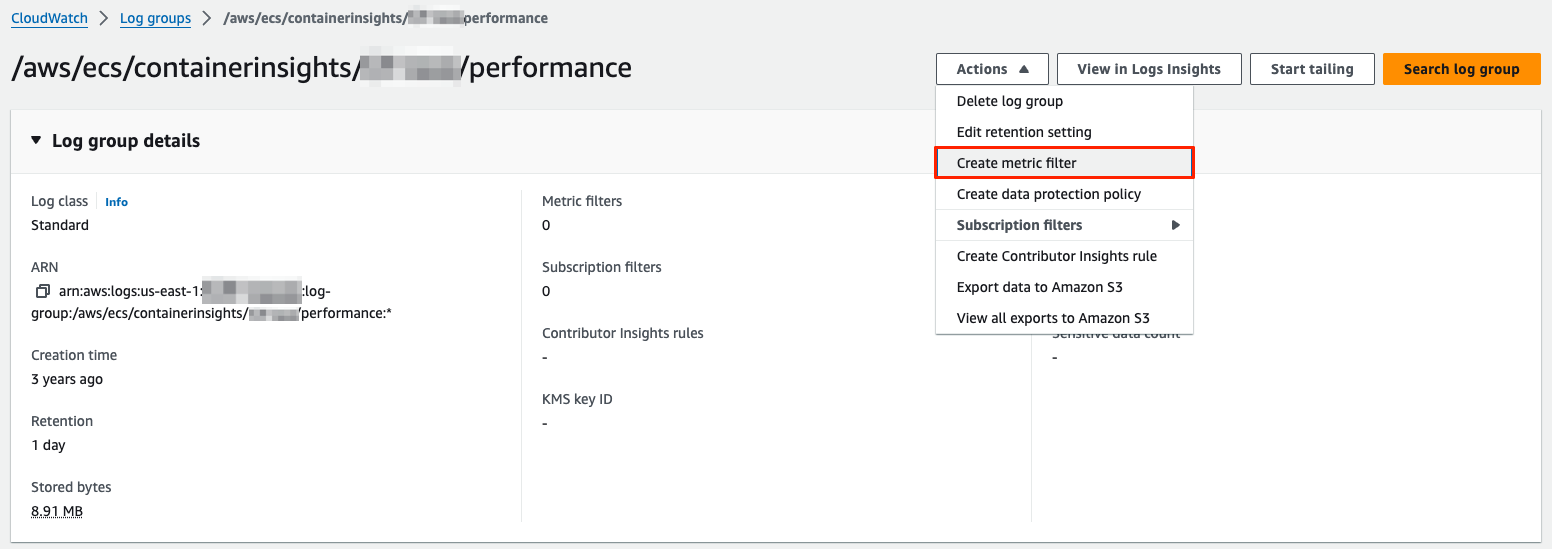
Go to the log group of CloudWatch Container Insights performance log in CloudWatch Logs. The log group name format is
/aws/ecs/containerinsights/<Your ECS Cluster Name>/performance.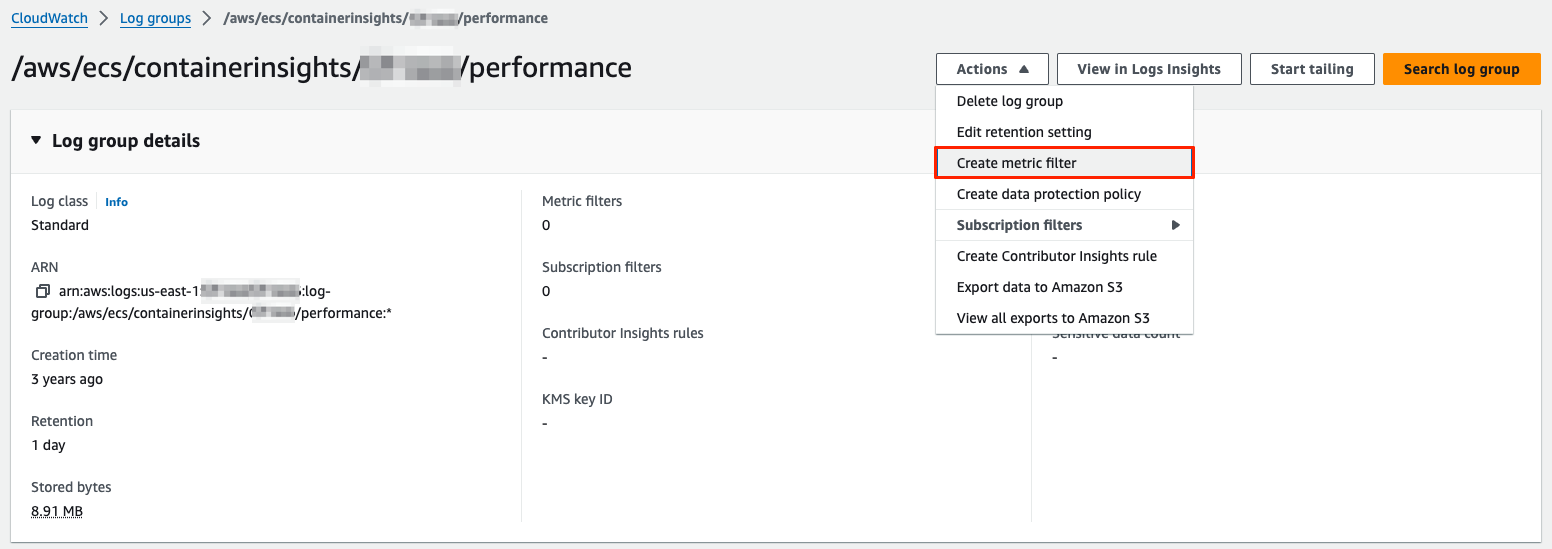
Create a metric filter for the log group of CloudWatch Container Insights performance logs. For Filter pattern, enter a filter pattern for task-level performance log of an ECS service name.
1
 { $.ServiceName = "Your-ECS-Service-Name" && $.Type = "Task" }
In this example figure, the ECS service name is “nginx-fargate-service”.
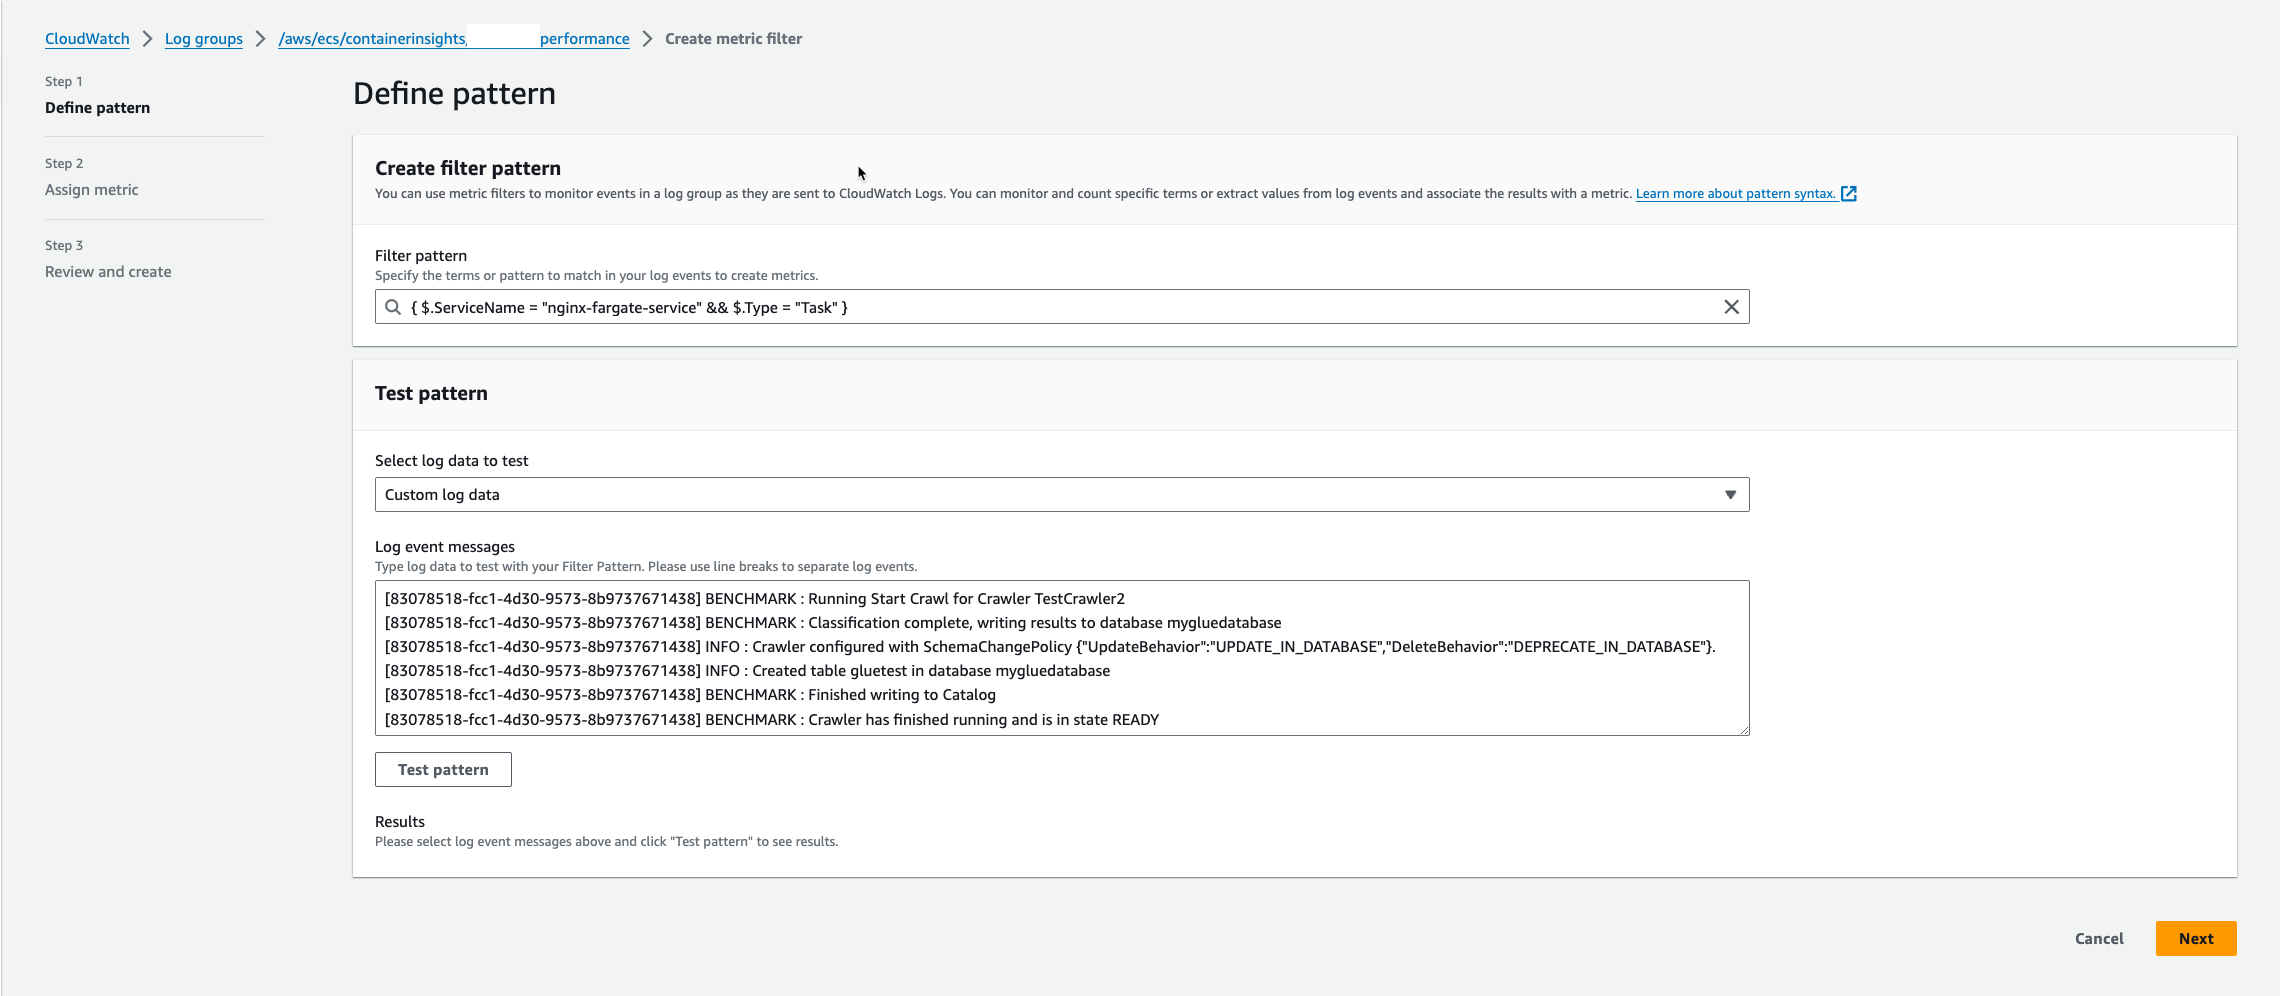
You can change the filter pattern syntax to match the naming of your ECS services. The metric filter quota is 100 per log group and cannot be increased. See also the billing consideration.
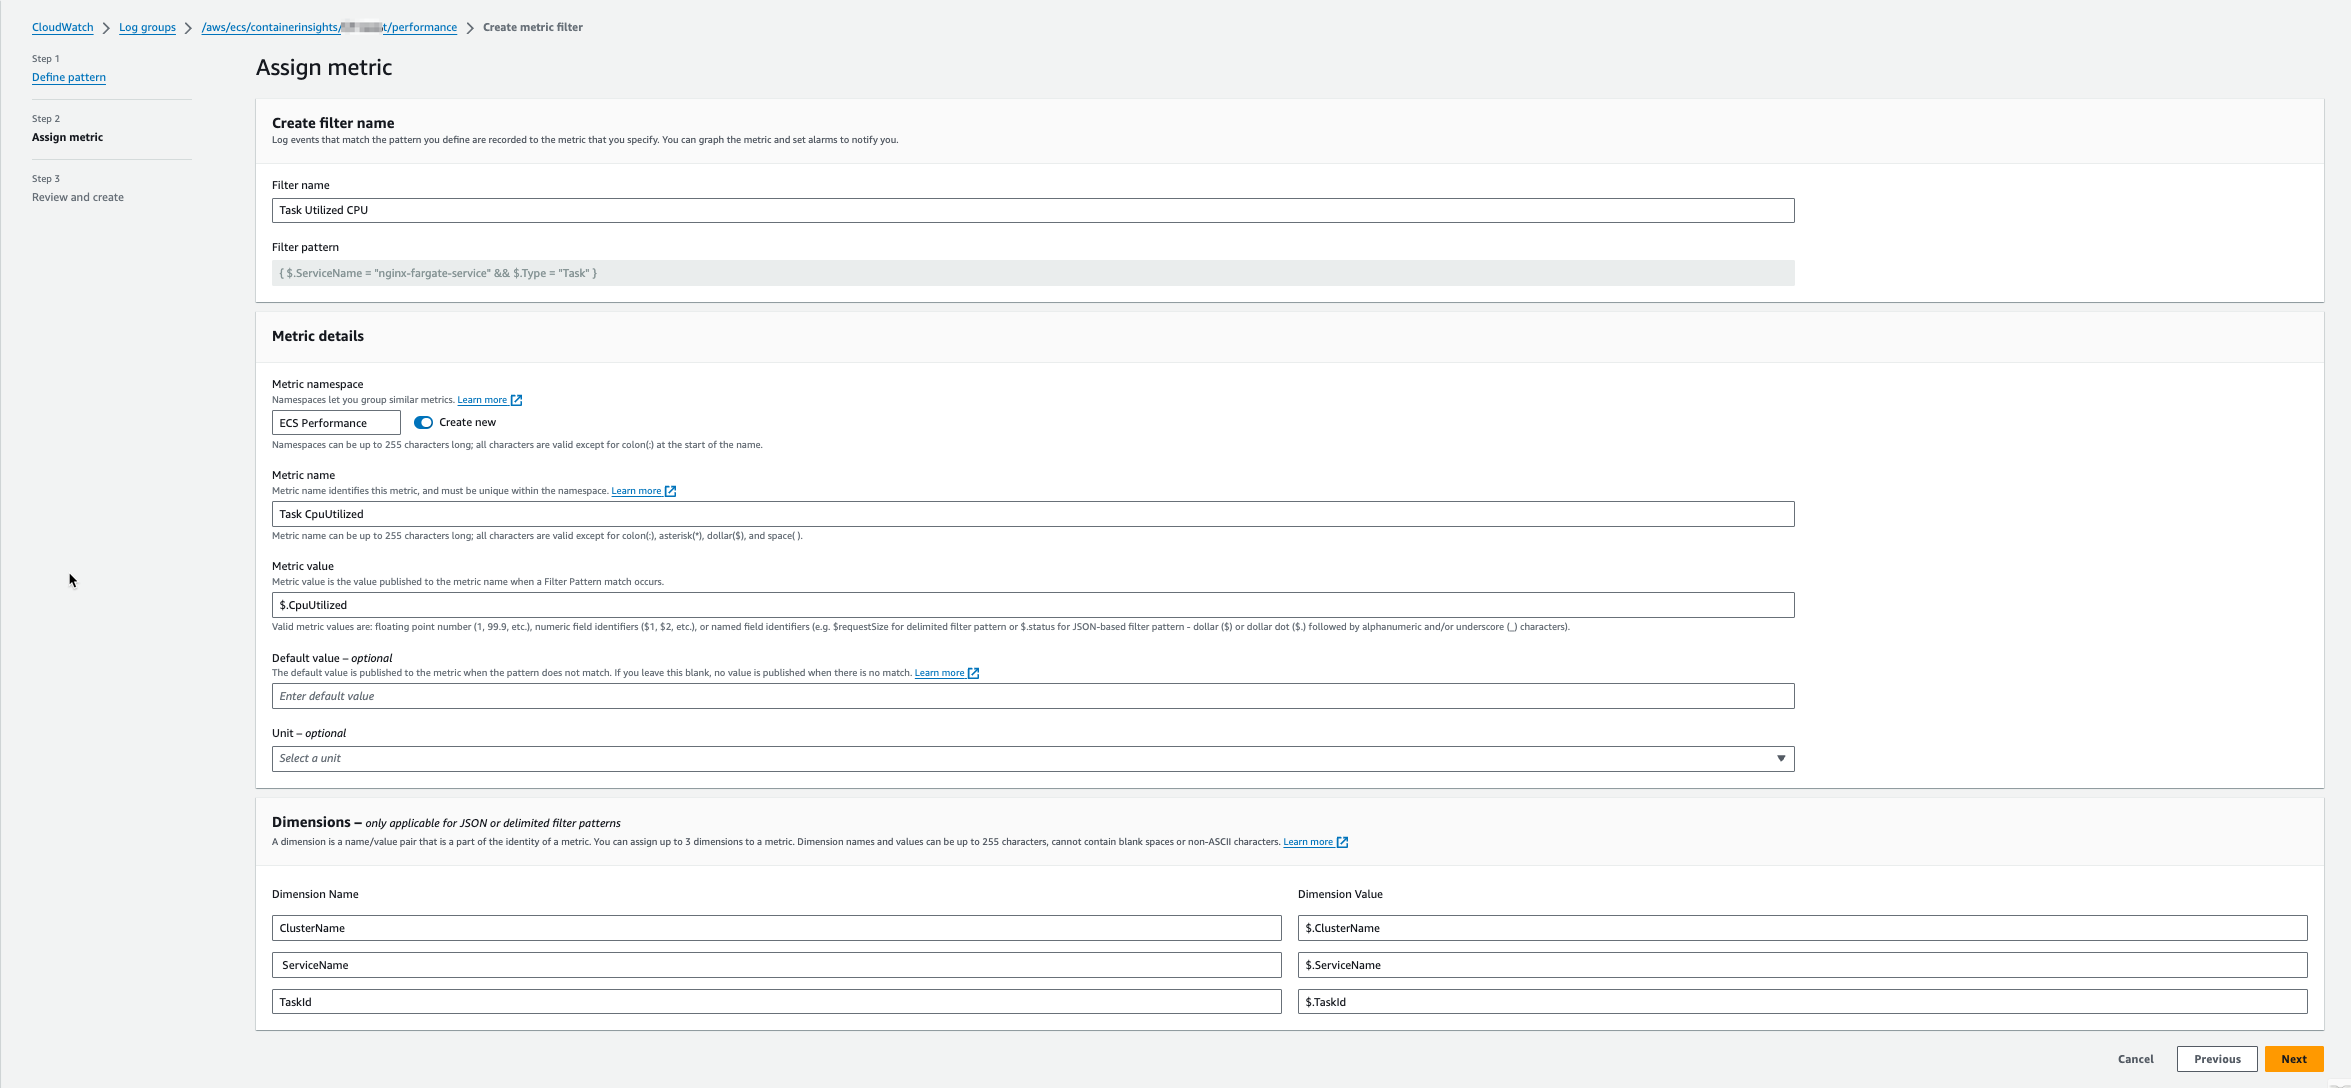
- Next, define the metrics on CloudWatch metrics:
- For Filter name, enter Task Utilized CPU.
- For Metric namespace, enter ECS Performance with Create new enabled.
- For Metric name, enter Task CpuUtilized.
- For Metric value, enter $.CpuUtilized.
- For Dimensions, enter the following:
- Name: ClusterName, Value: $.ClusterName.
- Name: ServiceName, Value: $.ServiceName.
- Name: TaskId, Value: $.TaskId.
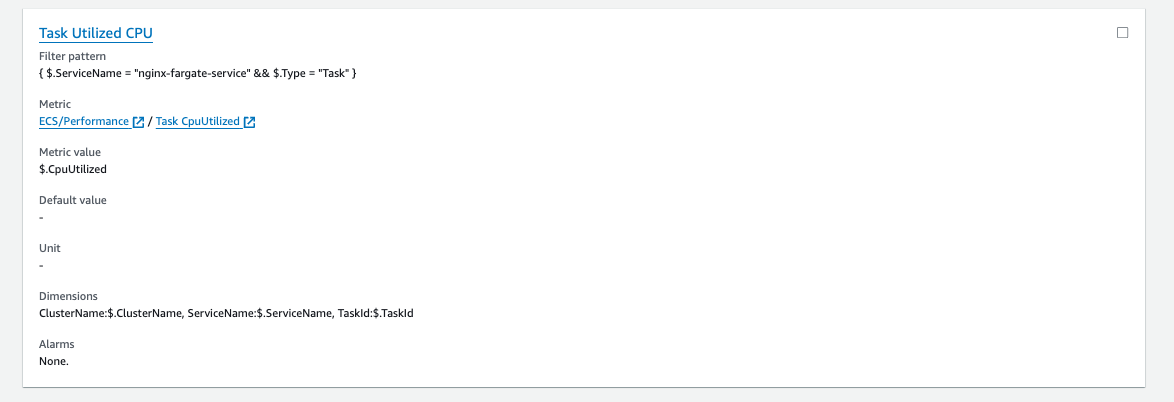
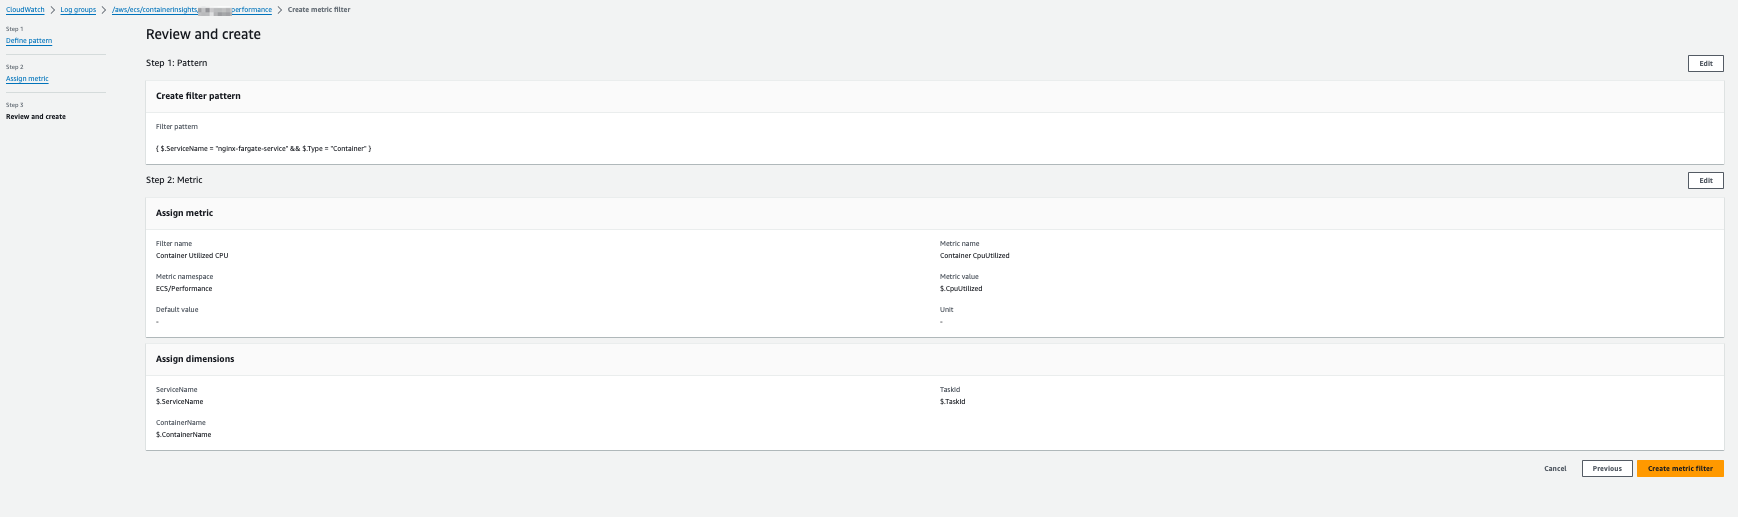
You can see now the overview of the metric filter creation.
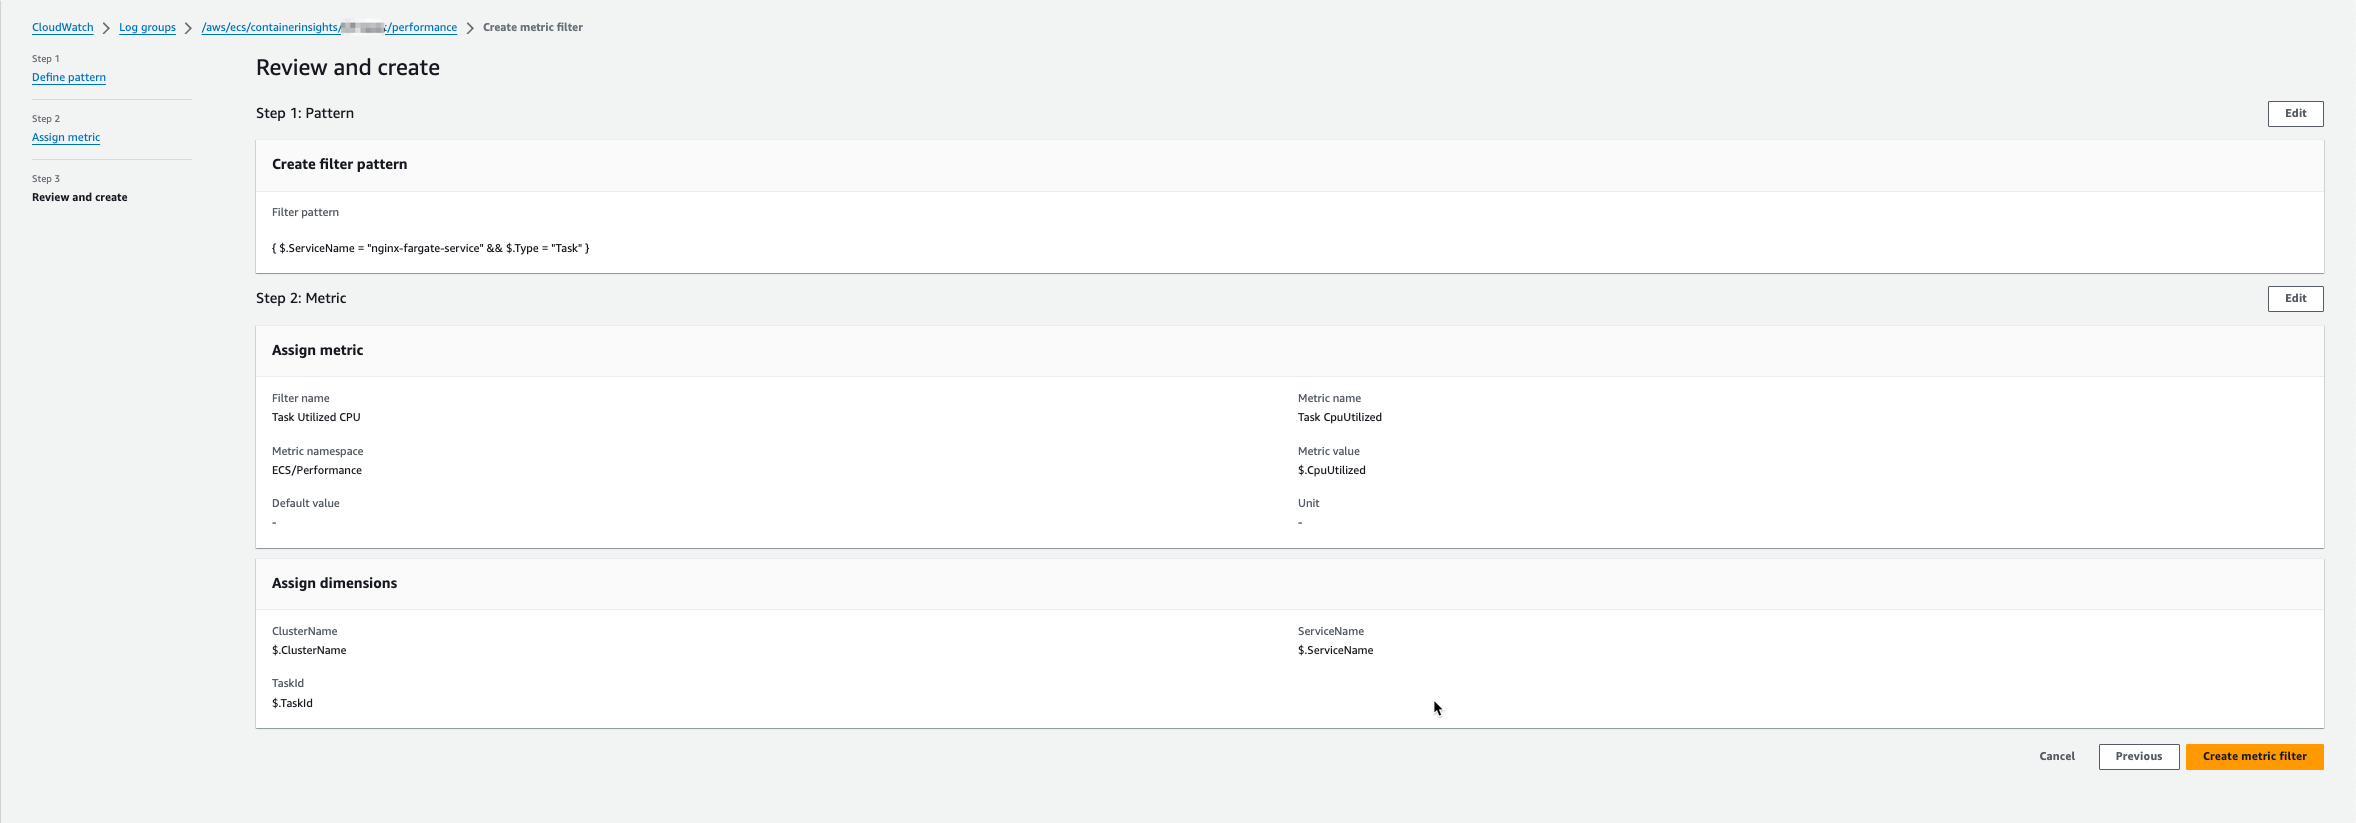
After creating the metric filter, on the CloudWatch Logs console you can see the created filter.
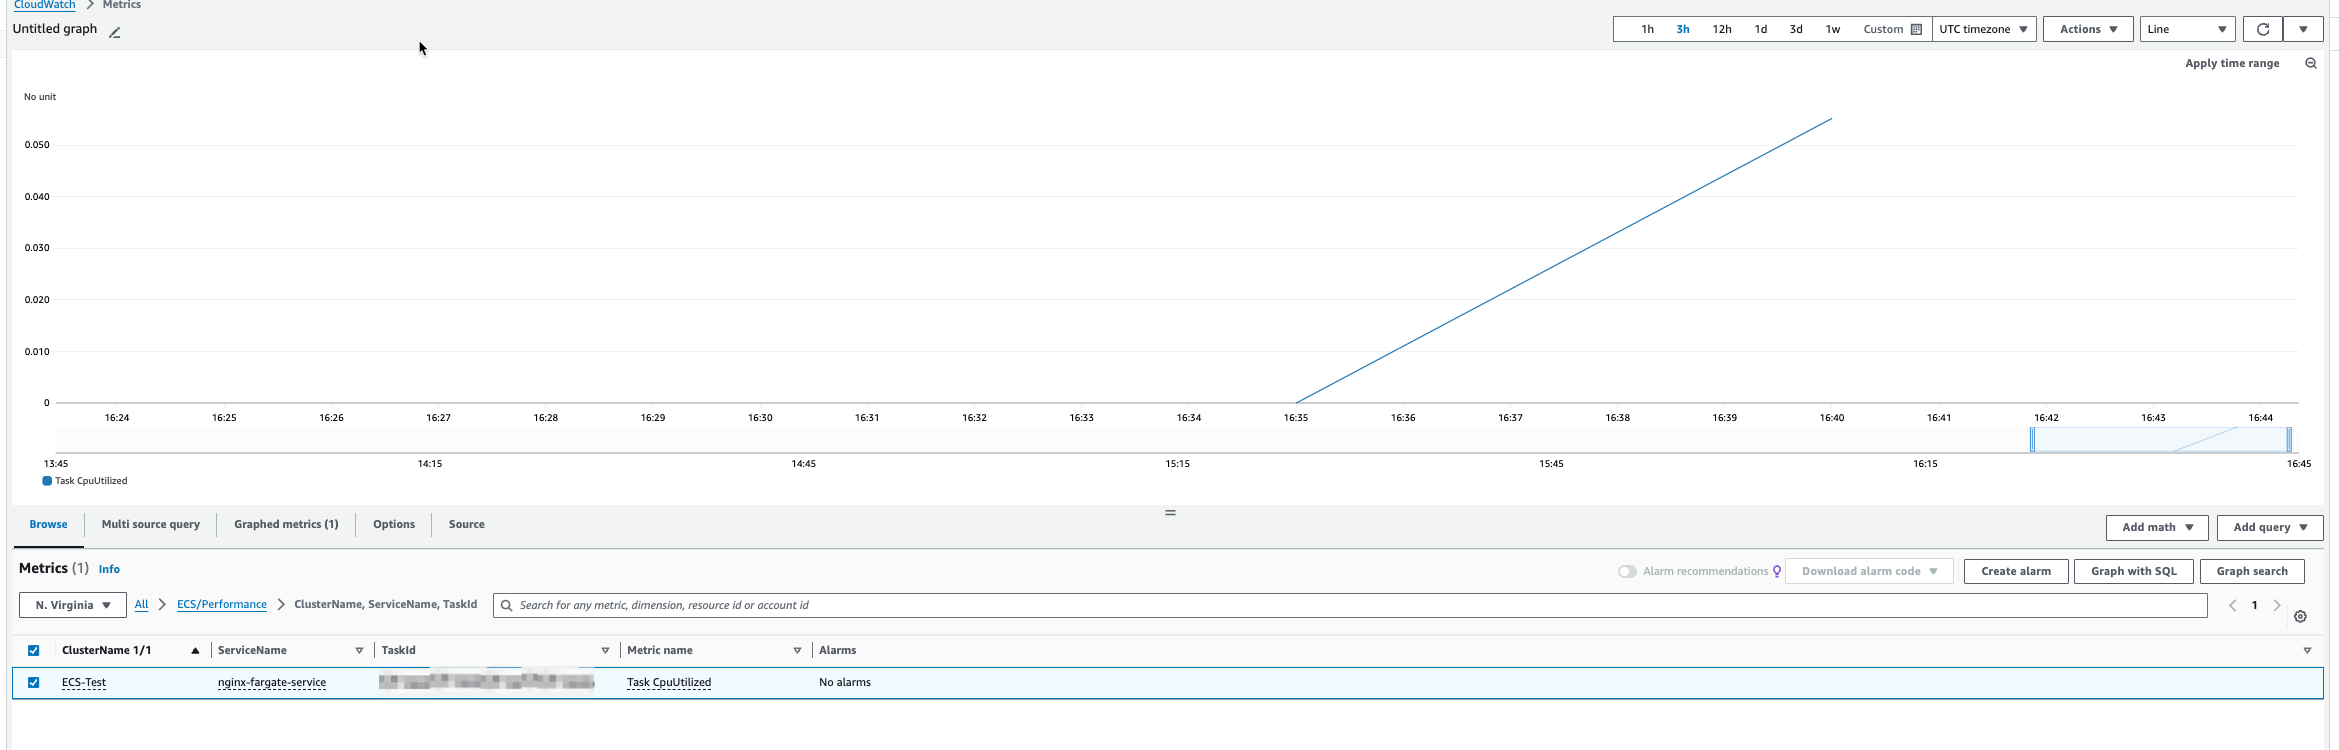
Click on the Metric name “ECS/Performance / Task CpuUtilized”, you can see the metrics of each ECS task CPU usage:
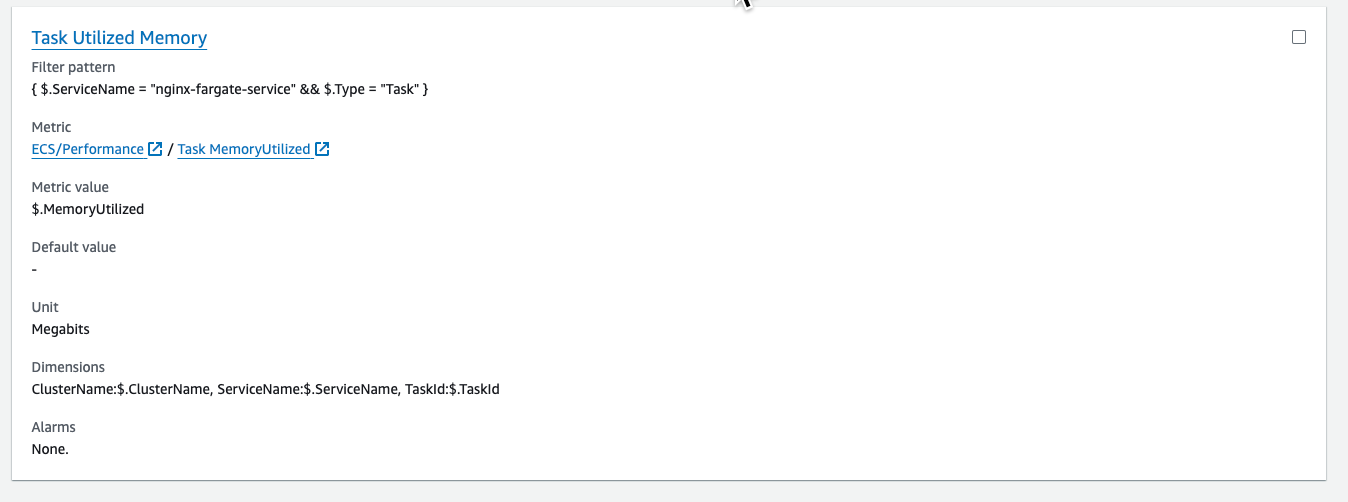
Using the same concept for task memory metrics, create another metric filter with the same steps for the metric filter of CPU. Create the same filter pattern
{ $.ServiceName = "nginx-fargate-service" && $.Type = "Task" }and filter the form as the following, modify the Metric value as $.MemoryUtilized.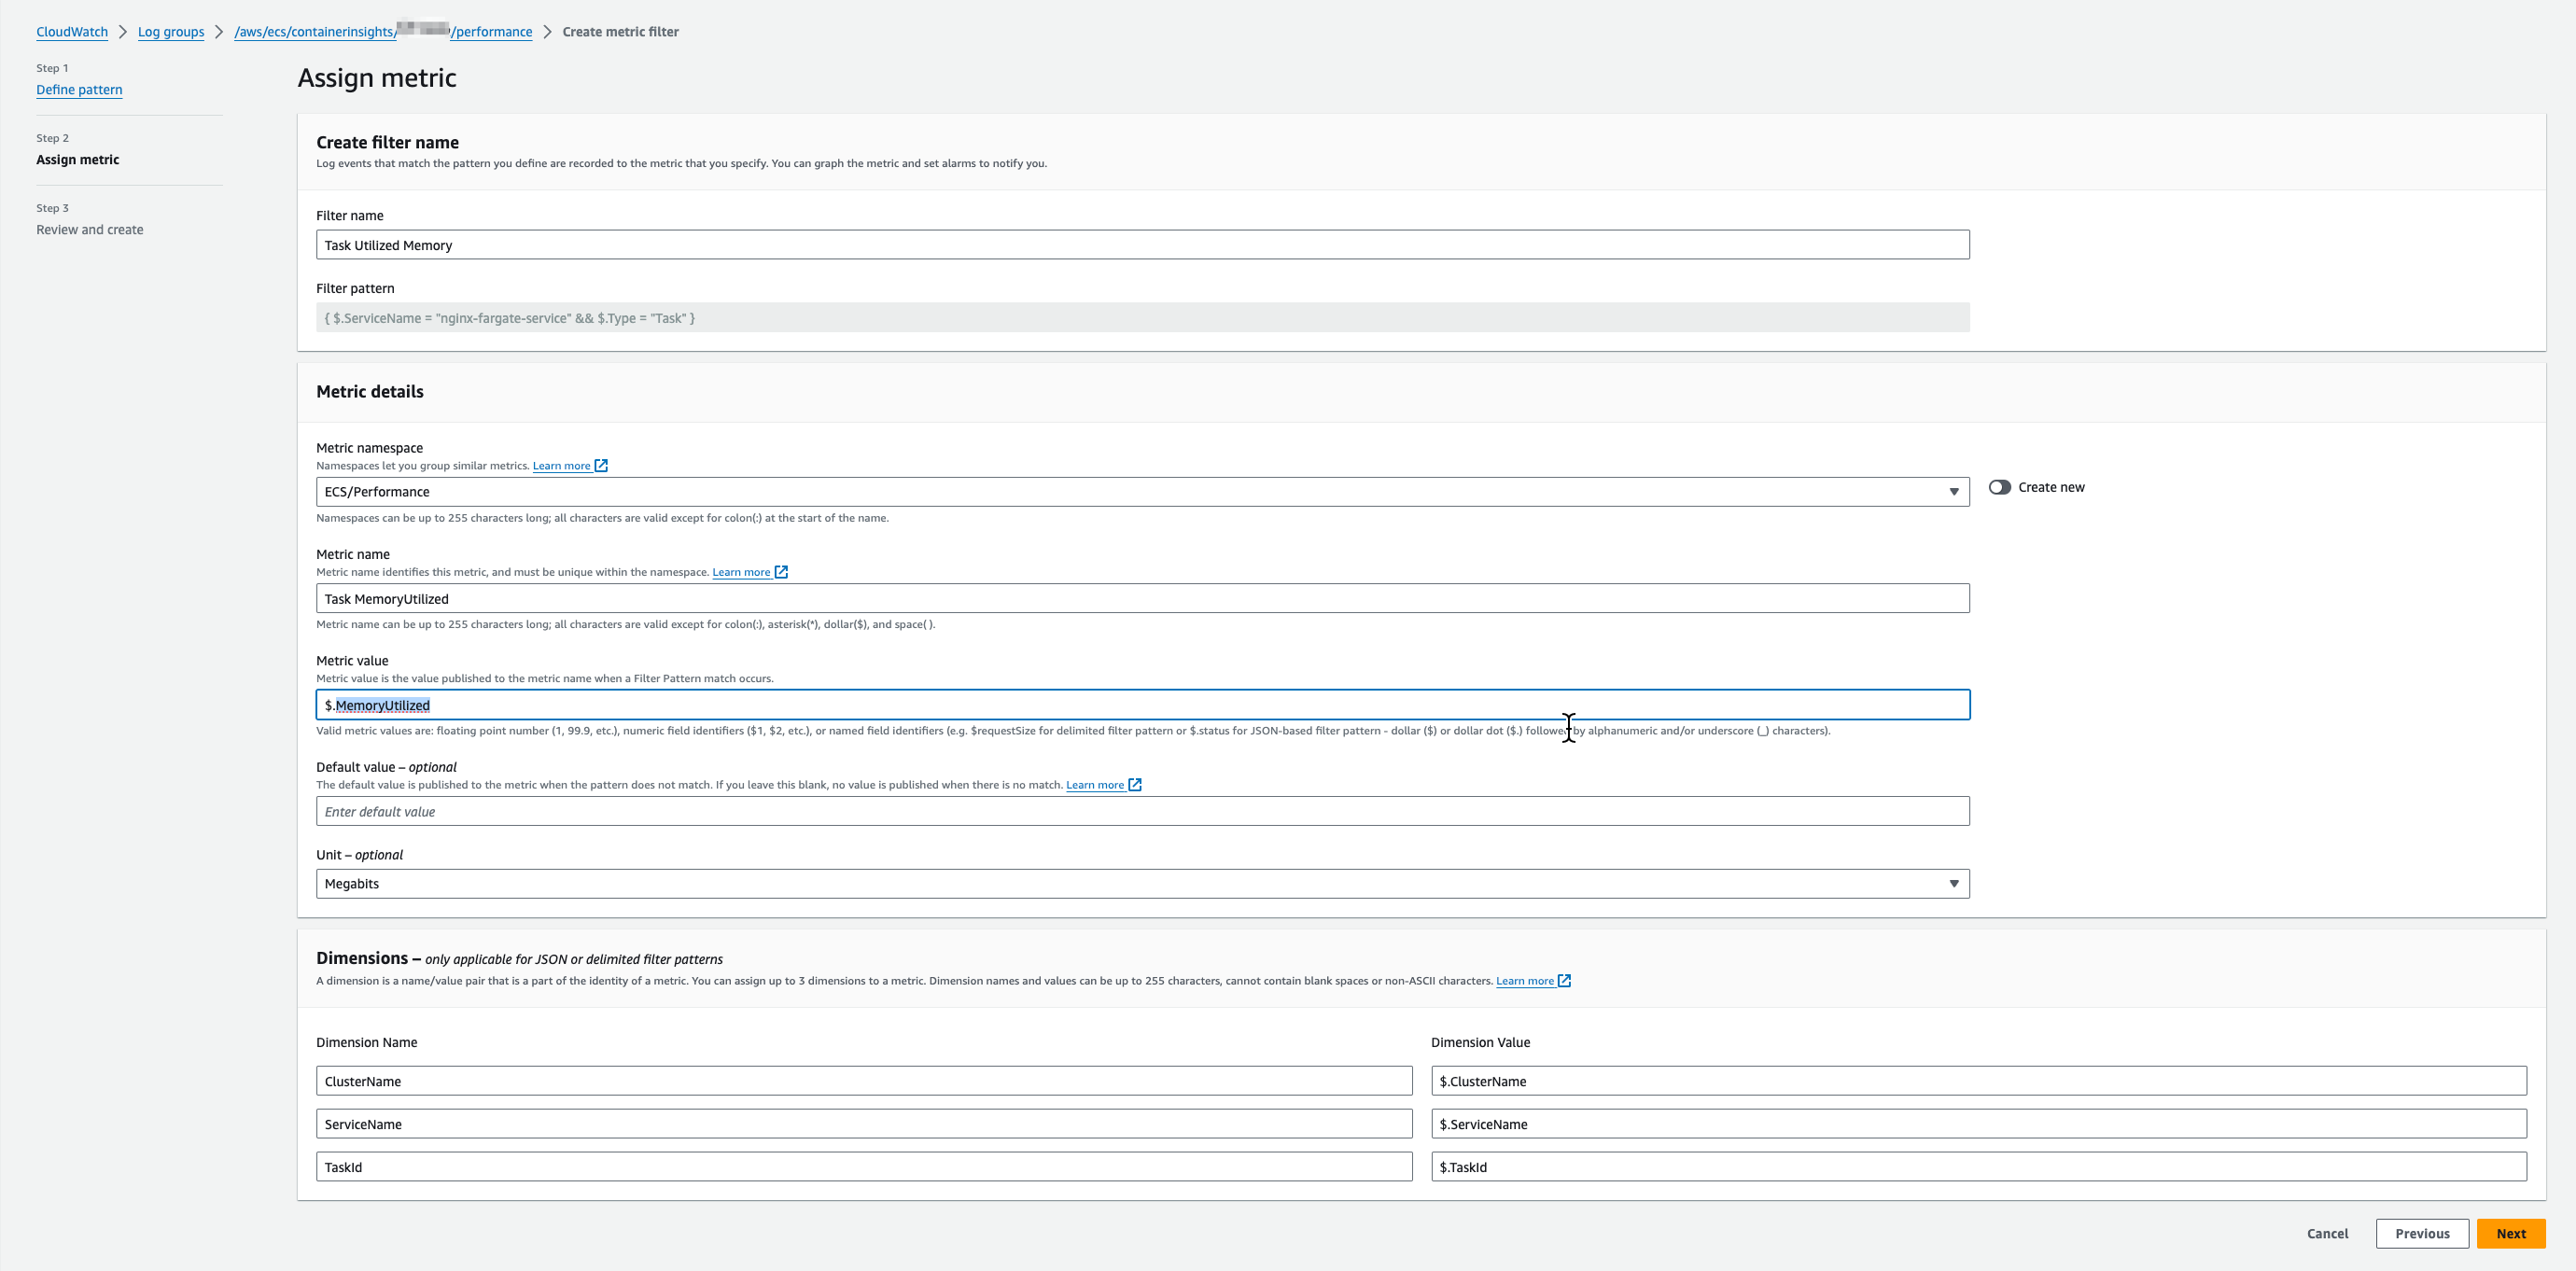
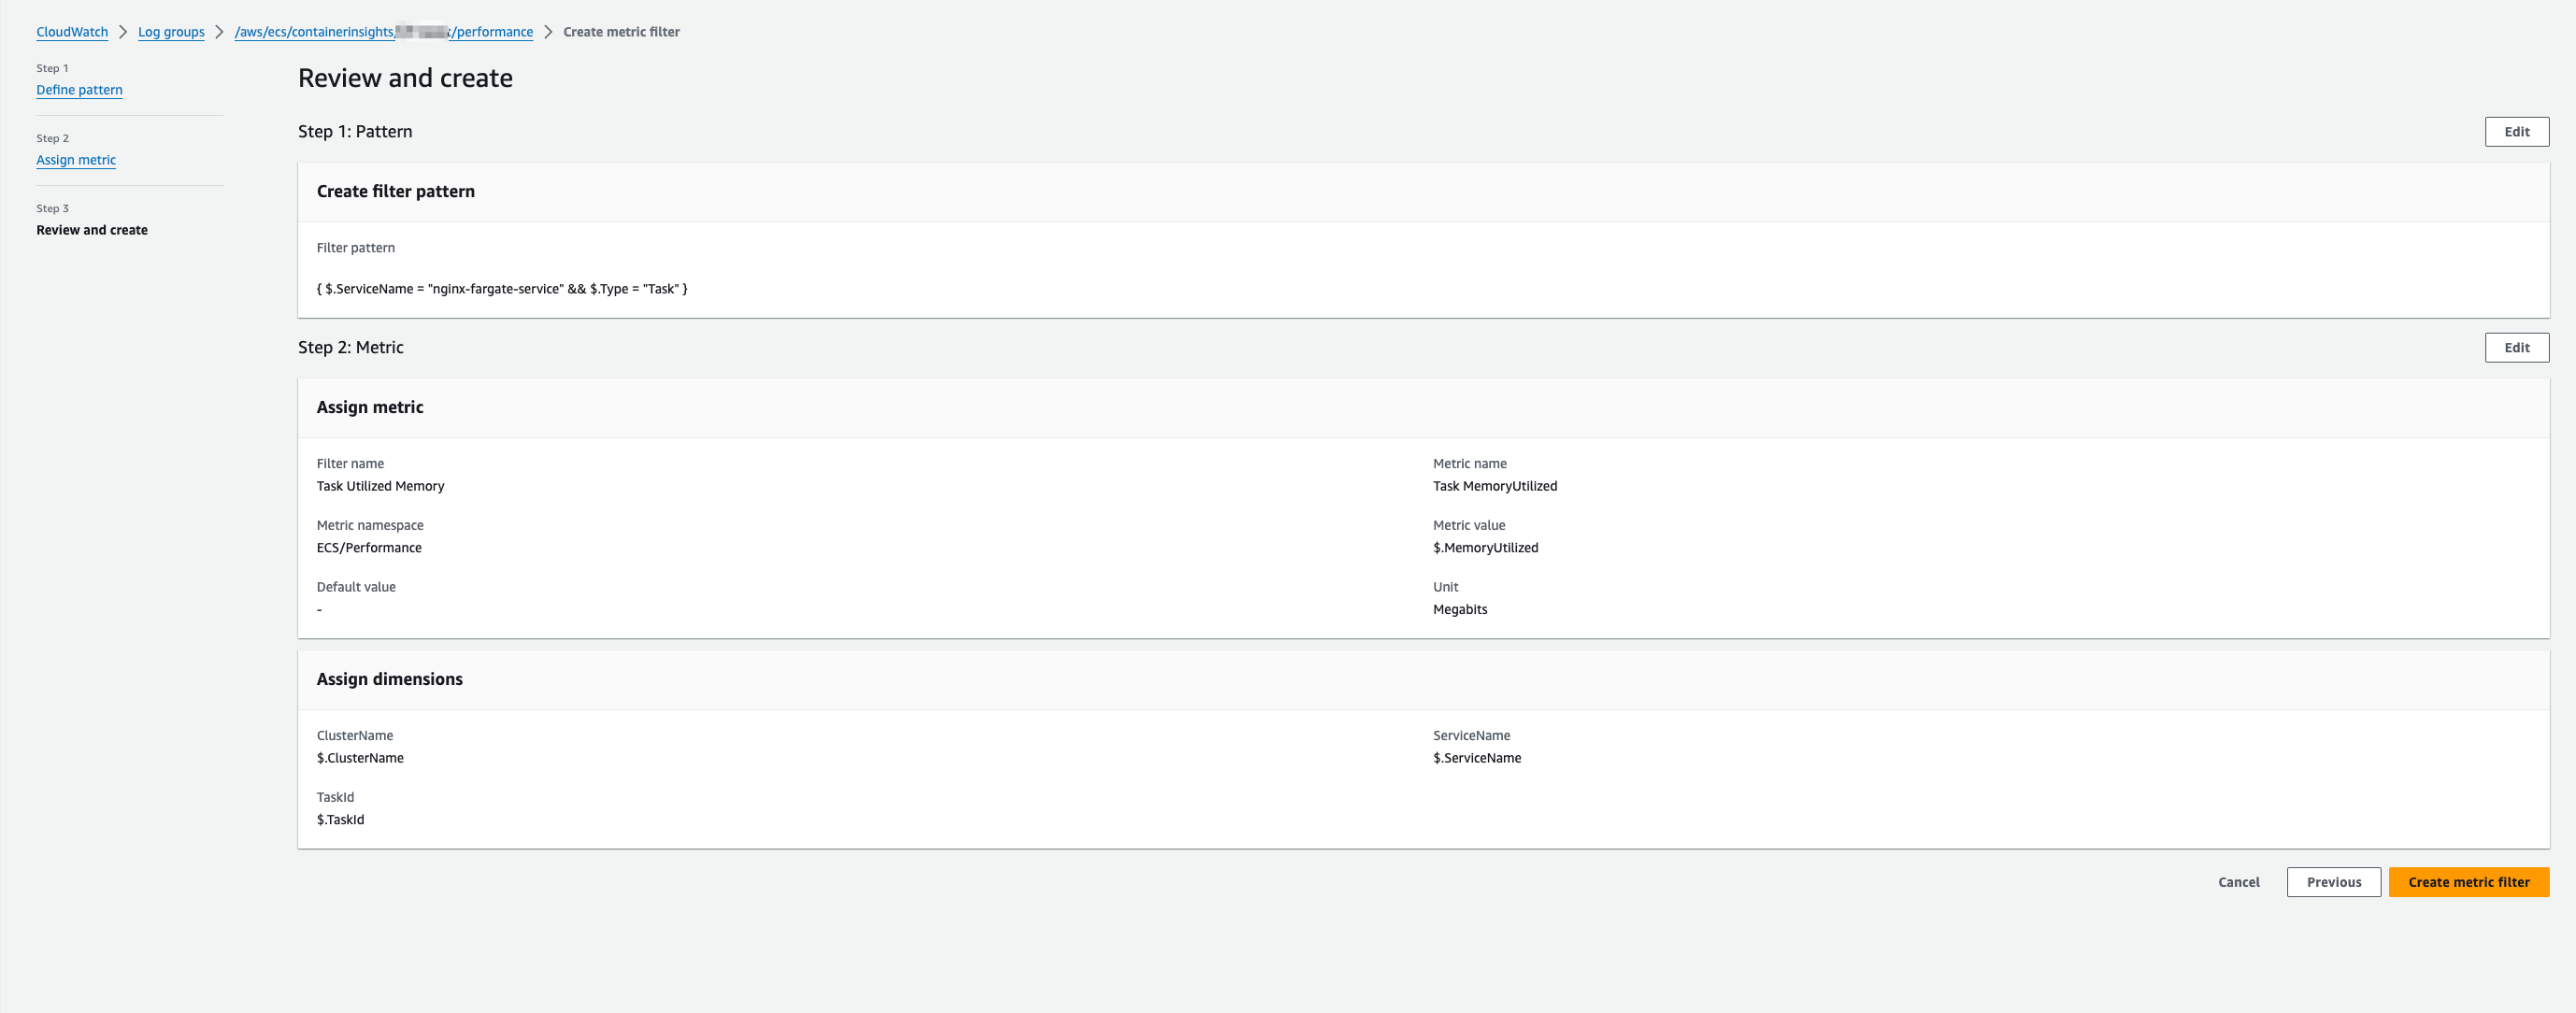
After creating the metrics filter for task memory you should see the created filter:
Container-level Metrics
The steps to setup container-level metrics are similar to the steps we tool for task-level metrics. Go to the same log group of CloudWatch Container Insights performance log in CloudWatch Logs.
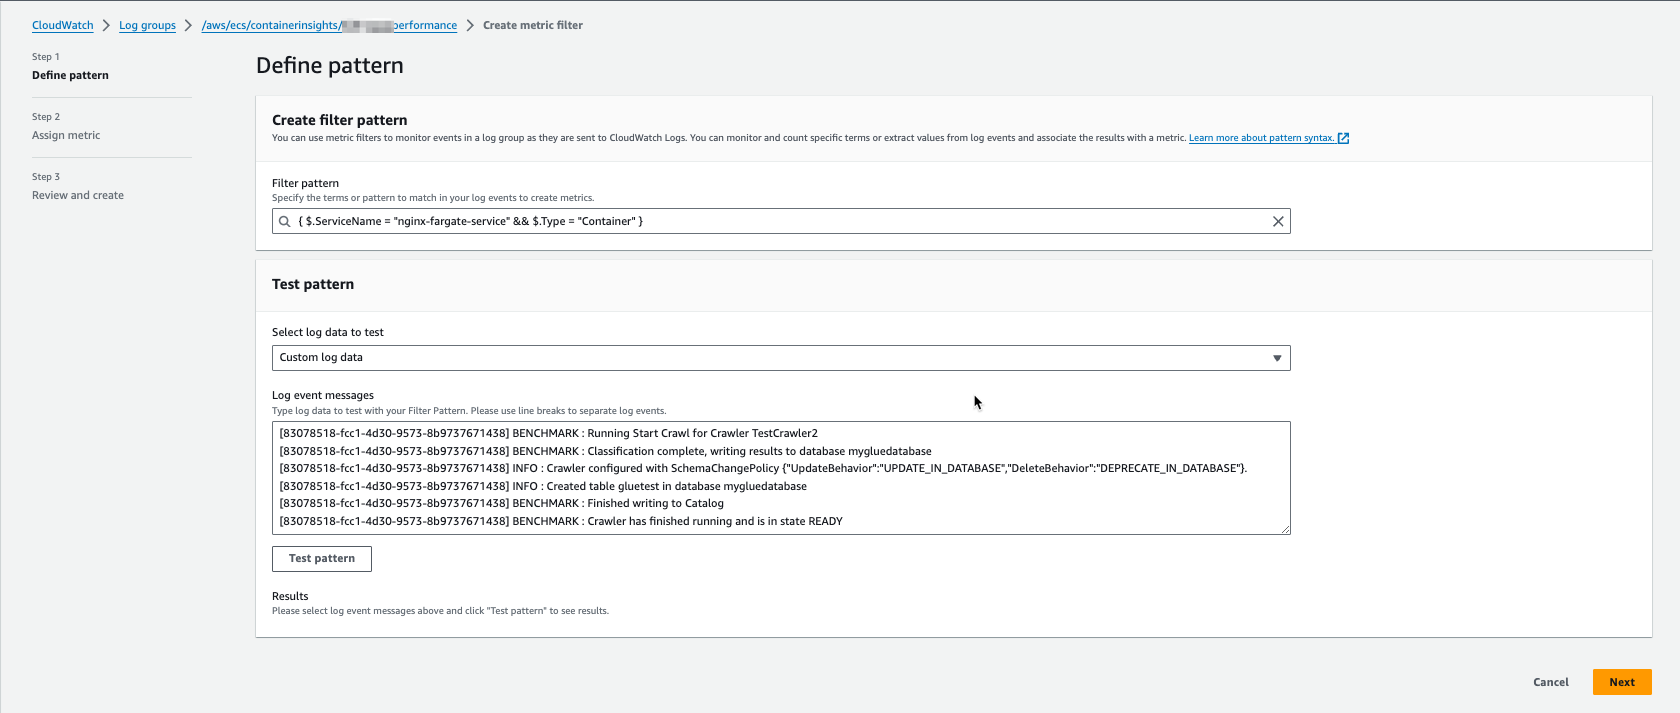
Create another metric filter for the log group of CloudWatch Container Insights performance logs. For Filter pattern, enter a filter pattern for container-level performance log of an ECS service name.
{ $.ServiceName = "Your-ECS-Service-Name" && $.Type = "Container" }In this example figure, the ECS service name is again the “nginx-fargate-service”:
- Next, define the metrics on CloudWatch metrics:
- For Filter name, enter Container Utilized CPU.
- For Metric namespace, choose the ECS Performance created previously without Create new enabled.
- For Metric name, enter Container CpuUtilized.
- For Metric value, enter $.CpuUtilized.
- For Dimensions, enter the following:
- Name: ServiceName, Value: $.ServiceName.
- Name: TaskId, Value: $.TaskId.
- Name: ContainerName, Value: $.ContainerName.
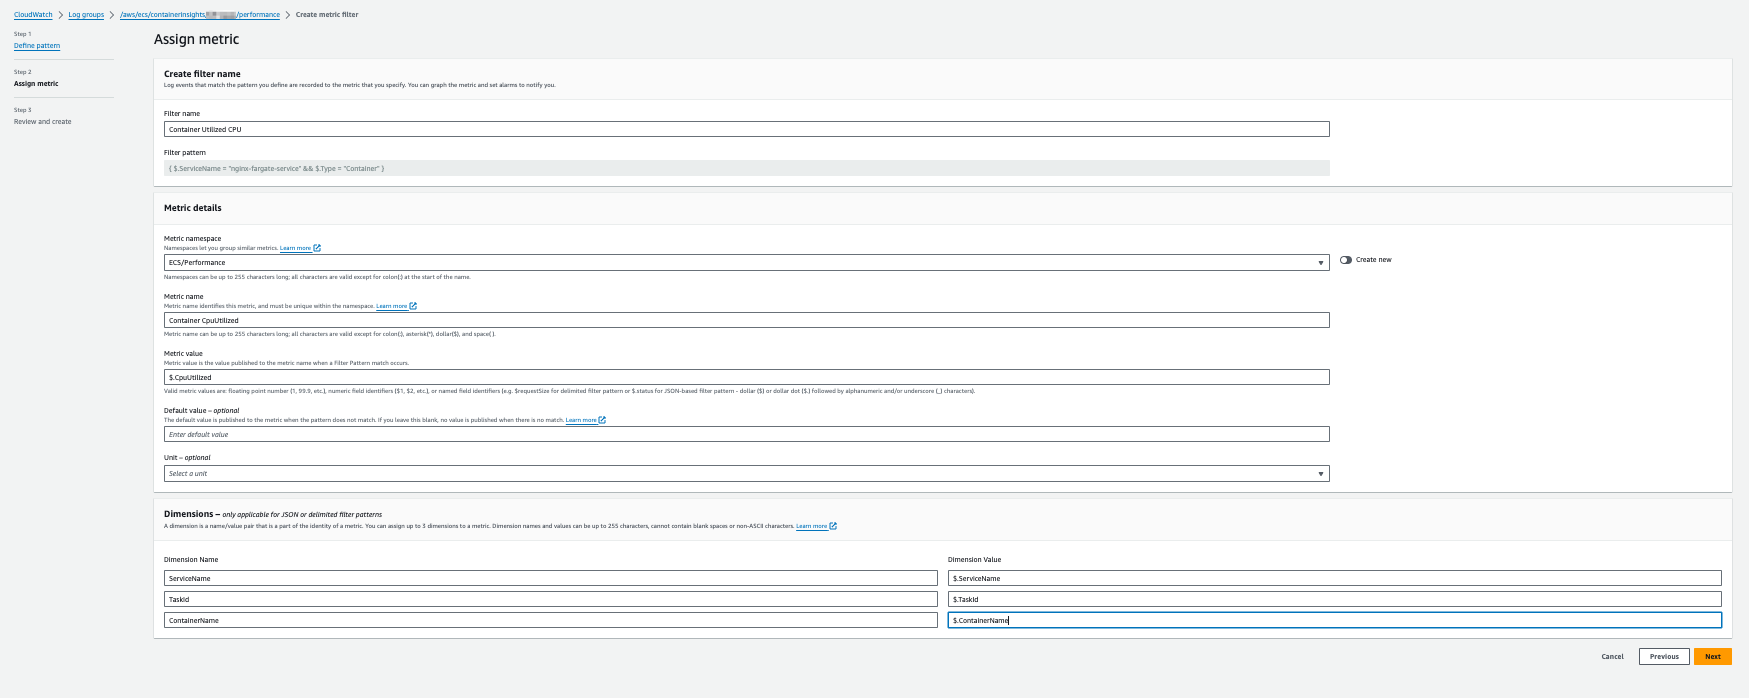
Since the metrics filter only support 3 dimensions, we did not include the cluster name here. You can change the dimensions based on your operation practice.
Next, you can see the overview of the metric filter creation and create the metrics filter.
Using the same concept, create another metric filter with the same steps for the metric filter of CPU. Create the same filter pattern
{ $.ServiceName = "nginx-fargate-service" && $.Type = "Container" }and filter the form as the following, modify the Metric value as $.MemoryUtilized.
If you extract metrics from log events, you will be charged for custom metrics. You can follow the steps in Deleting a metric filter topic to delete the metric filters created earlier.
Use cases
Now, when we set up metric filters for task- and container-level metrics, let’s review use cases where we can use those metrics.
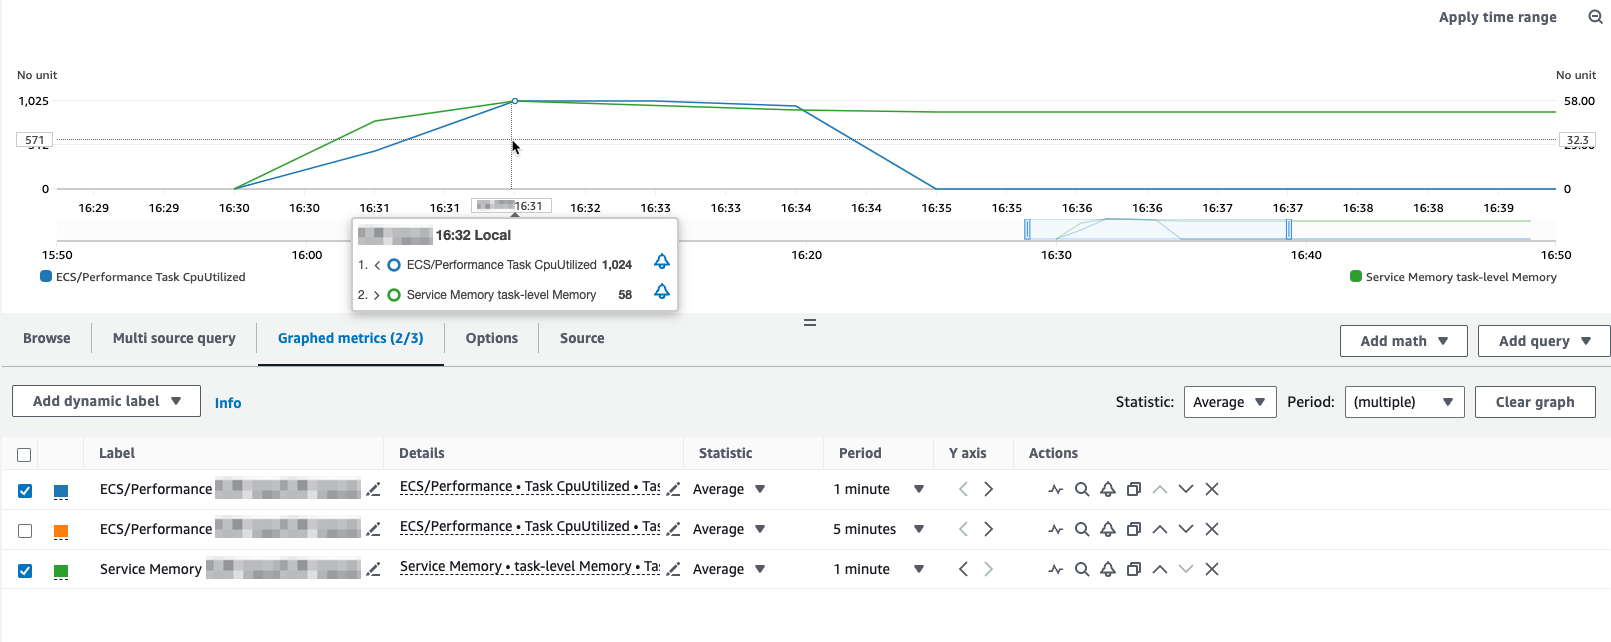
Monitor Task CPU and Memory.
We have an ECS task with task-level CPU limit of 2048 CPU units (2 vCPU) and memory limit of 2048 MBi. Then we execute a single thread command (like while true; do :; done) to consume 1024 CPU units. We can see the task-level CPU and memory metrics on the CloudWatch metrics:
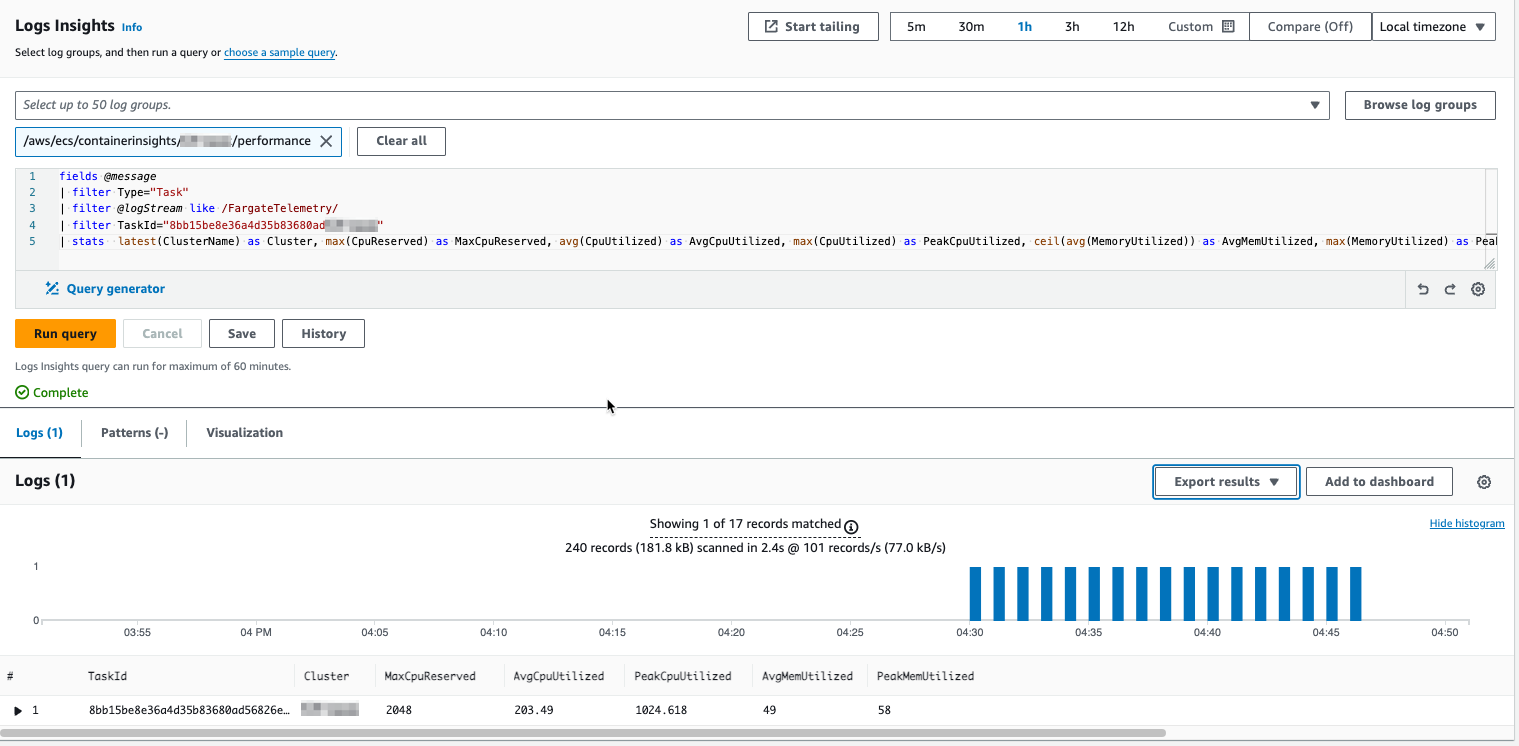
In one of AWS blog posts, it wrote how to use CloudWatch Container Insights performance metrics to query the raw data:
1
2
3
4
5
fields @message
| filter Type="Task"
| filter @logStream like /FargateTelemetry/
| stats  latest(ClusterName) as Cluster, max(CpuReserved) as MaxCpuReserved, avg(CpuUtilized) as AvgCpuUtilized, max(CpuUtilized) as PeakCpuUtilized, ceil(avg(MemoryUtilized)) as AvgMemUtilized, max(MemoryUtilized) as PeakMemUtilized by TaskId
| sort TaskId asc
We used this method to verify the CloudWatch metrics match to the CloudWatchContainer Insights performance log for the ECS task:
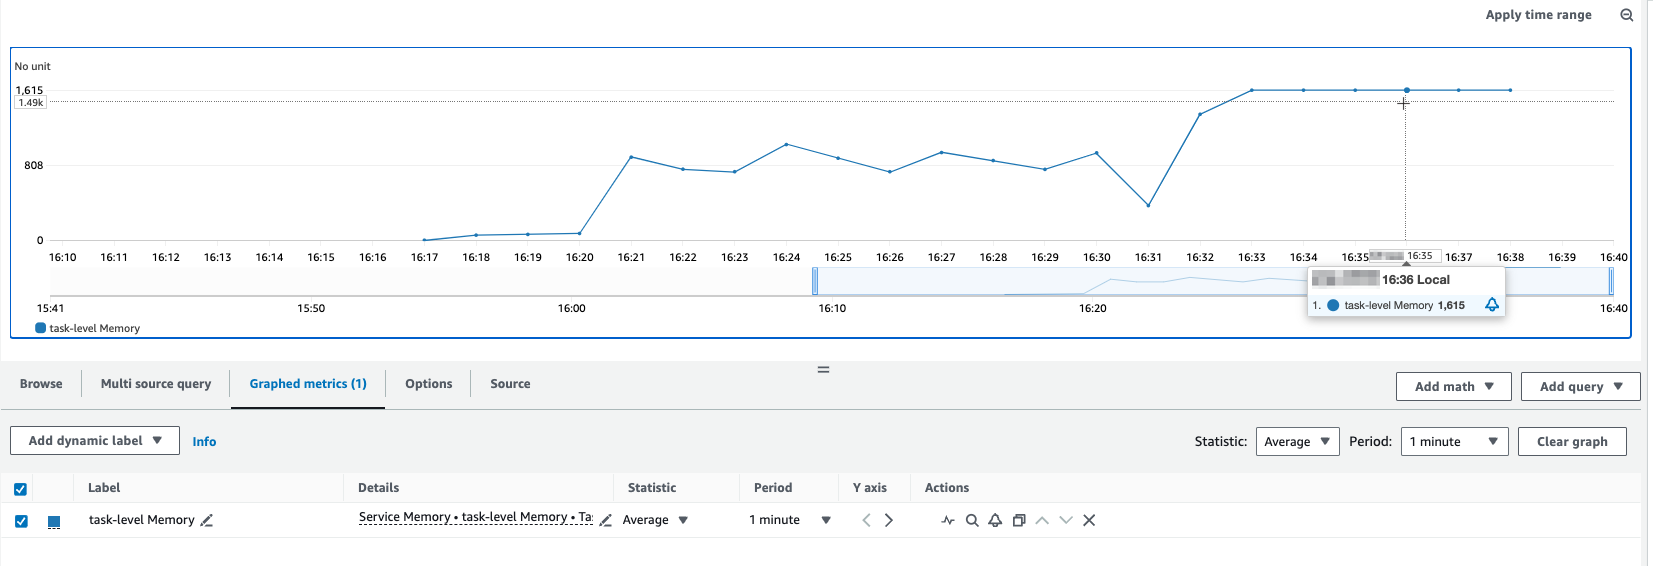
Monitor Container Memory.
When there are multiple containers in an ECS task, we need to dive into container-level metrics to understand which container consumes the resources. Let’s take another example of an ECS task with 3 different containers. We used the stress command to allocate 1.5 GB memory usage constantly in the container.
1
stress --vm 1 --vm-bytes 1536M --vm-keep
From a task-level memory metric, we can see the memory usage consumed by the ECS task:
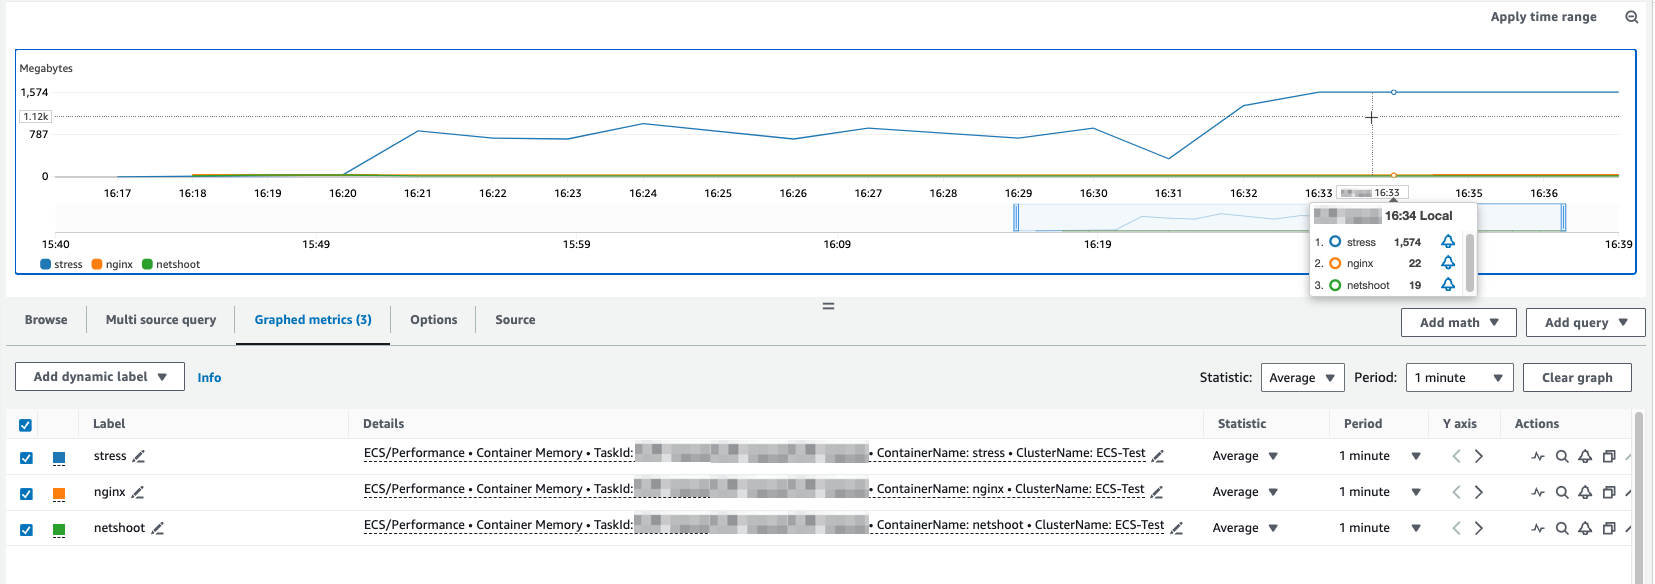
When checking the container-level memory metric, we can clearly see that it is the stress container that consumes high memory usage:
Conclusion
This article shows how you can use Amazon CloudWatch Container Insights to gain comprehensive visibility into the performance of your Amazon ECS workloads. By setting up metric filters to collect task-level and container-level performance metrics, you can easily identify resource-intensive tasks and containers, allowing you to optimize resource utilization and troubleshoot issues more effectively.